Sextant Framework 2.0
How We Find the Mispriced Ones
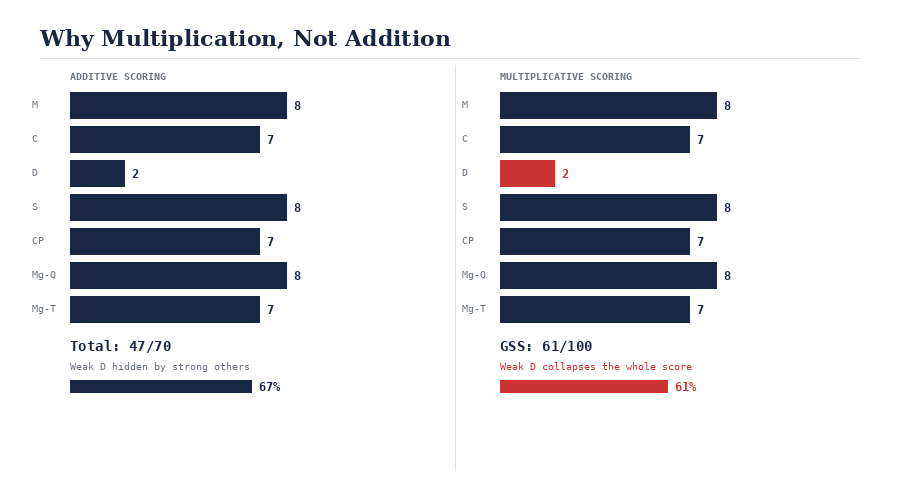
Seven dimensions. One multiplicative formula. No black boxes. If any dimension scores zero, the whole thesis dies. That's the point.
The Seven Dimensions
What the Framework Measures
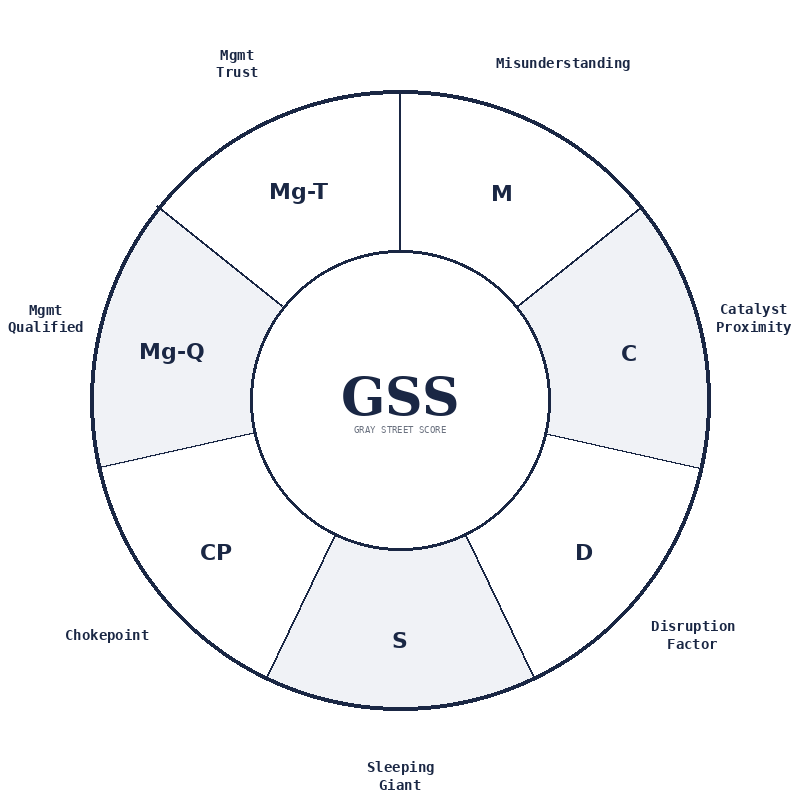
7 dimensions. Click to enlarge.
Each dimension is scored 1–10. The sub-scores within each dimension are auto-computed or manually set by JD, then combined into the dimension score. The composite formula above normalizes the result to a 100-point scale called the Gray Street Score (GSS). No dimension score ever returns zero or null. Scale is 1–10 only. Floor of 1 enforced everywhere in the pipeline.
MAuto
Auto-scored by scanner
Misunderstanding
The market doesn't understand the company. Analyst coverage is thin. Short interest is elevated because the story is counterintuitive. The 52-week position reflects prolonged neglect. The gap between the price target and current price is wide. All four of these create the setup — not any one alone.
The Delbert version: Is the stock cheap because nobody's looked at it, or cheap because it deserves to be cheap? Misunderstanding is the first check.
CAuto
Auto-scored by scanner
Catalyst Proximity
Something is coming. Volume is spiking above normal. RSI is in oversold territory. SEC 8-K filings are accelerating. These are the pressure gauges. A good thesis with no catalyst is a boat with no engine. C measures how close the detonation point is.
DAuto / Override
Auto-scored — JD override available
Disruption Factor
Is this company doing something that threatens an established market structure? Not incremental improvement — structural displacement. D is set manually because the kind of disruption that matters requires qualitative judgment. The scanner cannot read a patent filing and understand that it rewrites the supply chain physics of an entire industry.
The Delbert version: Could this company put somebody big out of business, or just take some market share?
SAuto / Override
Auto-scored — JD override available
Sleeping Giant
The asset base, technology, or IP is vastly larger than the company's market cap implies. Nobody has noticed. A gold mine priced like a mailbox. A patent portfolio that controls the next generation of a market sitting on the balance sheet at cost. S measures how deeply the market is undervaluing what's already there.
The Delbert version: Is there a lot more there than the price tag suggests?
CPAuto
Auto-scored only — never manually overridden
Chokepoint
The company controls a critical input, process, or geography that others cannot easily replicate or substitute. Chokepoint value is structural — it persists through cycles. CP is elevated automatically for companies in sectors the framework classifies as strategically critical.
CP is self-reinforcing when CP reaches threshold in a strategically critical sector: the framework treats this as an additional resonance condition (see Resonance, below).
The Delbert version: If this company disappeared tomorrow, who would have a serious problem?
Mg-QAuto
Auto-scored by scanner
Management Qualified
Can the team execute? Mg-Q uses insider ownership percentage as the primary proxy. Skin in the game is the most honest alignment signal available from public data. Founders who own 20% of the company behave differently from hired executives who own nothing.
Mg-TOverride
Default 7 — JD override available
Management Trust
Has management been honest? Mg-T defaults to 7 platform-wide. It requires reading earnings calls, tracking guidance accuracy, and applying judgment built over years of watching people talk about money under pressure. Adjusted with a logged reason, almost always down. Low trust disqualifies the thesis even if every other dimension is screaming.
The Delbert version: Would you lend these guys your truck?
Scoring Legend
What Each Dimension Reads
| Dimension | What It Reads | Source |
|---|
| M Misunderstanding | Analyst coverage, short interest, 52wk position, target gap | Auto |
| C Catalyst Proximity | Volume anomaly, RSI oversold, SEC 8-K velocity | Auto |
| D Disruption Factor | Market size vs valuation, revenue trajectory, supply chain | Override |
| S Sleeping Giant | Coverage depth, institutional attention, ownership trend | Override |
| CP Chokepoint | Sector classification, structural control of critical input | Auto |
| Mg-Q Mgmt Qualified | Insider ownership percentage | Auto |
| Mg-T Mgmt Trust | Earnings call accuracy, guidance history, behavior under pressure | Override |
Auto Scanner computed. No human input. Override Scanner or platform default. JD can lock with a logged reason.
Resonance Layer
When Dimensions Reinforce Each Other
The GSS is the foundation. Resonance is a separate layer built on top of it. Resonance scores pattern combinations — when multiple dimensions align in ways that historically precede large moves. Hard cap applies when management trust falls below threshold.
Superset suppression: Tidal Wave (S+M+C) absorbs both the standalone M+C pattern and the C→M pattern when all three co-occur. You don't double-count them.
| # | Pattern | Dimensions That Fire | What It Means |
|---|
| 01 | Tidal Wave | S + M + C all elevated | Complete setup. Large, fast move. |
| 02 | Underdog Rally | M + C elevated | Misunderstood + catalyst forming. |
| 03 | Grizzly Wake | S + D elevated | Sleeping giant with disruption. |
| 04 | CP Self-Reinforcing | CP + critical sector | Structural control compounding. |
| 05 | Pressure Cooker | C high, M persistent | Wrong consensus meeting deadline. |
| 06 | Iron Triangle | M + CP + D elevated | Misunderstood chokepoint disruptor. |
| 07 | Full Alignment | All 7 dimensions | Complete Sextant signal. Rare. |
| 08 | Compression Signal | Volume + M + RSI + snapshots | Timing discriminator. Spring coiled. |
| 09 | Institutional Fingerprint | Dark pool + short vel + options | Smart money already positioned. |
When 3+ patterns align the signal is strong. Tidal Wave absorbs smaller patterns.
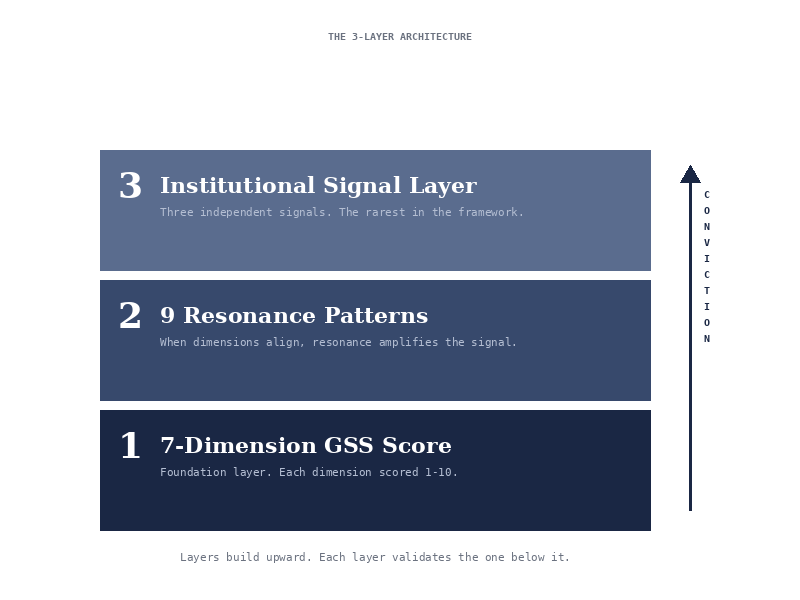
How the layers build conviction. Click to enlarge.
01
The Tidal Wave
S + M + C all elevated simultaneously. The asset is deeply undervalued (S), widely misunderstood (M), and a catalyst is forming (C). This is the complete setup. When all three arrive together the move, when it comes, tends to be large and fast.
Superset: absorbs the Underdog Rally (M+C) and the Pressure Cooker (C→M) when active.
02
The Underdog Rally
M + C elevated. The stock is misunderstood and a catalyst is forming. Standalone pattern — significant but smaller than Tidal Wave. Absorbed by Tidal Wave when all three (S+M+C) are present.
03
Grizzly Wake
S + D elevated. A sleeping giant with disruptive technology or structural position. Only evaluated when D has been scored for the ticker. The combination of "more there than priced" and "threatens an established order" is a particularly dangerous combination for short sellers.
04
CP Self-Reinforcing
When CP reaches threshold and the sector is classified as strategically critical: structural control of a critical resource or process doesn't just protect margin — it compounds. Each quarter at the chokepoint is a quarter competitors can't replicate.
05
Pressure Cooker
High catalyst proximity meeting persistent misunderstanding. The market is wrong and the evidence is building. This is not a subtle setup — the disconnect between fundamentals and price is measurable and the resolution is closer than the price implies. Absorbed by Tidal Wave when S also elevated.
06
The Iron Triangle
M + CP + D all elevated. Misunderstood company with a structural chokepoint and disruptive technology or position. Rare. When it appears the combination of misunderstanding, structural moat, and disruptive upside creates a compounding asymmetry that the market almost never prices correctly.
07
Full Alignment
All seven dimensions elevated simultaneously. The complete Sextant signal. Every dimension of the thesis is firing at once. In three years of running the framework across several hundred tickers, this has occurred fewer than a dozen times. When it does, it gets immediate priority research attention.
08
The Compression Signal
Empirically discovered, March 2026. Volume or technical pressure at elevated levels. This is not a thesis pattern — it's a timing discriminator. In backtest analysis across the confirmed call set, 5 of 7 confirmed calls showed the Compression Signal active at or before the catalyst event. It doesn't say the thesis is right. It says the spring is coiled.
The Compression Signal is displayed as a gold dot on the Scorecard.
09
Institutional Fingerprint
Three independent institutional signals detected simultaneously. The rarest
pattern in the framework. When it fires, someone who knows something is already
positioned.
THE CONVICTION LAYER
Direction and Conviction
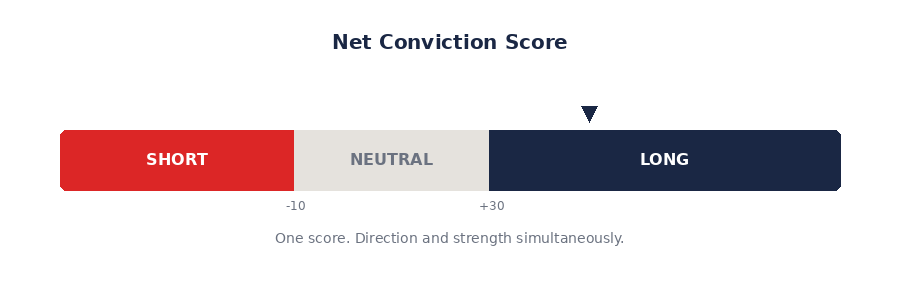
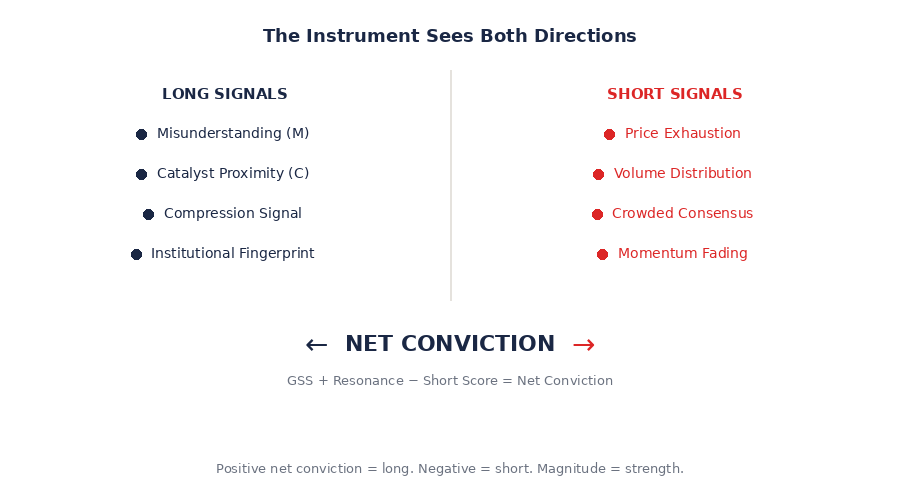
The instrument produces one number that tells you both direction and strength at the same time.
Net Conviction = GSS + Resonance − Short Signal Score
Click to enlarge
Above +30 means the instrument sees more opportunity than risk. That is a long candidate. Below −10 means the opposite pressure is stronger. That is a short candidate flagged for review. Between those lines is the neutral zone — no edge, no trade.
The distance from zero is the magnitude. A net conviction of +80 is not the same as +32. The number tells you how hard the instrument is leaning. Delbert would say: a gentle push and a hard shove both move in the same direction, but only one of them means business.
Short candidates are never published autonomously. The instrument flags them. JD decides.
INVERSE SIGNALS
The Short Signal Layer
Click to enlarge
Every ticker in the universe gets scored on both sides of the ledger simultaneously. The long framework looks for misunderstanding, compression, and institutional accumulation. The short framework looks for the opposite — exhaustion, distribution, and crowded consensus.
Eight inverse signals measure overextension. Price near 52-week highs. Volume declining as price holds. Short interest already squeezed out. RSI overbought. Analyst coverage fully priced with no upside remaining. Options positioning shifting toward puts. Momentum fading while price holds. Catalysts already reflected in the price.
Four short patterns can fire when those signals align. Distribution Signal fires when volume dries up at the highs. Exhaustion Pattern fires when momentum fades as news flow peaks. Overcrowded Trade fires when analyst consensus has fully priced the upside. Dead Cat Setup fires when the instrument score is falling while the price is still rising — the WARNING tension state.
The short signals run on every morning scan. No separate process. No additional API calls. The same scan that finds long opportunities surfaces short candidates as a byproduct.
COMPRESSION DURATION
The Time Variable
Click to enlarge
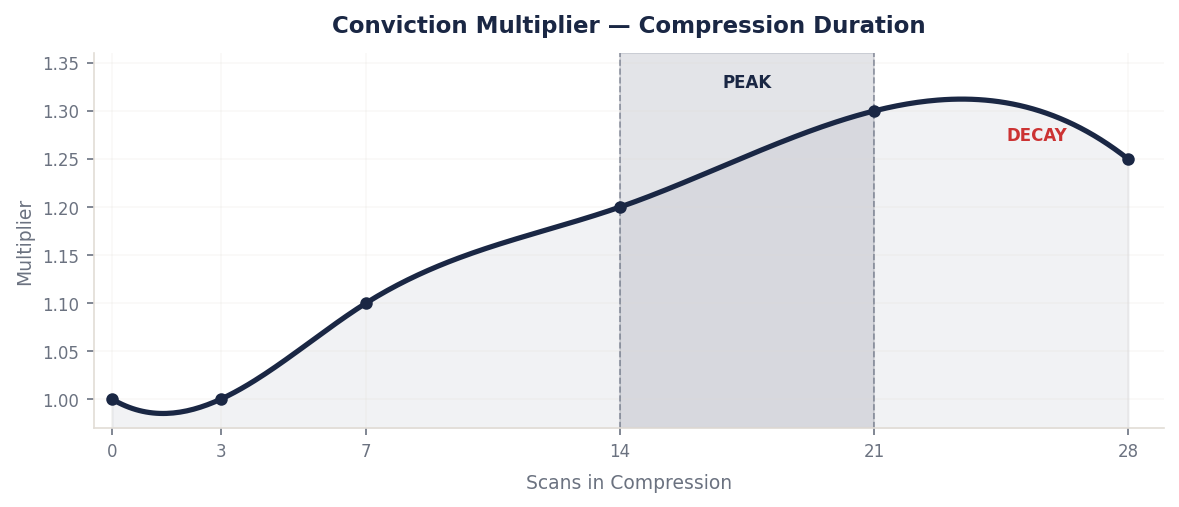
A spring that has been coiling for three weeks is more dangerous than one that started yesterday. The instrument tracks how long each ticker has been in compression state and adjusts conviction accordingly.
The multiplier starts at 1.0 and rises as compression sustains. Eight to twenty-one consecutive scans is the peak window — conviction gets its highest adjustment here. Beyond twenty-one scans the multiplier begins to decay. A compression that refuses to resolve is not building forever. At some point it becomes a question mark.
The time variable does not change the GSS. The instrument score stays clean. What changes is the conviction score that the research engine uses for flagging and the daily brief uses for context.
Every new ticker gets three days of baseline data seeded automatically on its first scan. The velocity calculations and time variable have something real to work with from day one instead of waiting for history to accumulate.
Harmonic Tension
Predicting the Release Sequence
Harmonic Tension is distinct from Resonance. Resonance scores pattern strength. Harmonic Tension predicts order of events. When certain dimension combinations occur together, the framework infers which catalyst will resolve first — and which will compound afterward.
Example: A thesis where C is high but S is low suggests the catalyst may resolve without the full revaluation the sleeping giant thesis implies. The move happens, but the second leg doesn't. Harmonic Tension analysis is currently in development as part of Sextant 2.0 Phase 2.
Sextant 2.0 — Phase 1
Dimension Velocity and Acceleration
The original Sextant scored each dimension as a static snapshot. Sextant 2.0 Phase 1, deployed March 22, 2026, adds velocity and acceleration tracking to every dimension.
VVelocity
Velocity is the rate of change in a dimension score between consecutive scans. A dimension moving from 4 to 6 in three weeks is more actionable than one sitting at 7 for six months. The snapshot says 7. Velocity says 6 and climbing — which means it'll be 8 next week if the pattern holds.
AAccel
Acceleration is the rate of change of velocity. A dimension accelerating upward is a stronger signal than one moving at constant velocity. Acceleration identifies when a setup is entering its final compression phase before resolution. The scanner calculates both from consecutive scans per ticker.
"Can you explain it in two sentences that a 70-year-old farmer from western Missouri would follow? If you cannot — the explanation is wrong, not the farmer."
The Delbert Test
Every score, every thesis, every published Sextant output must pass the Delbert Test. Before anything is published, it must survive being explained in plain language. If it requires jargon to be persuasive, the understanding is incomplete. Delbert doesn't care about your model. He wants to know if the company makes sense.
The Thesis Input Rule
D (Disruption), S (Sleeping Giant), and Mg-T (Management Trust) all have scanner or platform defaults — but JD can override and lock any of them with a logged reason. These three dimensions are the human layer of the Sextant. They are also the dimensions most likely to catch a fatal flaw that quantitative screens miss entirely.
Sextant 2.0 — Phase 3 Preview
The Tensor Field Model
The Sextant dimensions do not operate independently. Movement in one dimension influences the others through the underlying market structure. Phase 3 of the framework formalizes this relationship. Documentation pending.
Custom Optimization Model — Phase 4. The framework's self-calibration layer. Rollout documentation in progress.
Risk Modifier
Green / Yellow / Red
The Risk Modifier is a qualitative overlay applied after scoring. It does not change the GSS or Resonance score — it contextualizes it.
Green
Thesis confirmed, management aligned, catalyst visible. The setup is clean. The primary risk is timing, not outcome.
Yellow
One or more dimension has a known uncertainty. The thesis is intact but a specific risk — regulatory, balance sheet, execution — creates a conditional element. Yellow means watch, not avoid.
Red
A thesis-threatening condition is present. The Sextant score may still be positive but a fundamental risk — capital structure, pending litigation, management change — overrides the quantitative signal until resolved. Red means wait.
The scorecard is free. The research library is Pro.
About
JD Bailey
Thirty years working bars. Not writing about them — working them. Late nights, close calls, people at their most honest. What you learn behind a stick is that money is the clearest window into character. Watch how people behave when they're up, watch how they behave when they're down. The patterns repeat. The tells are the same whether the stakes are a $40 bar tab or a $40 million quarterly miss. First principles don't change with the setting. That's the foundation this whole thing is built on.
The Sextant Framework came from the same instinct: find the real signal in the noise. Not the consensus read, not what the sellside is saying. The question that always mattered was simpler — does this company make sense? Is there something real here the market hasn't looked at yet? The scanner automates the data layer. The judgment still has to be human. That's what Delbert would have said. That's what this is.